
I came across this article via a Hacker News post. This mentioned that SQLite was able to handle –
400 write transactions per second, and thousands of reads
I’ve recently started implementing applications with SQLite and with journal_mode set to WAL so that multiple concurrent writes could be done. However, I was curious to confirm the concurrent transactions number.
Earlier, I have used SQLite for development but usually on production we would face challenges with the notorious Database is locked error, we would move to Postgres or MySQL. However, I’ve always felt that for 90% of the applications we create don’t require these and was keen to back it up with numbers.
So, I decided to use Apache JMeter to try load testing a sample application.
I wanted to do in two ways –
- Directly call the database using a JDBC connection
- Call the database via an application
This post is for the former test. I’ll add the latter test in a separate post.
Installing Apache JMeter
Installing JMeter was straight-forward on Windows. Just download from the Downloads page, and unzip it somewhere and finally add the location to the PATH environment variable.
Load test using JMeter JDBC connector
For this, I needed to download the JDBC driver from here and then extract the sqlite-jdbc-<version>.jar file and put it in the JMeter lib directory before starting JMeter.
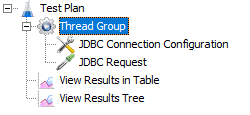
When JMeter is started, a default, empty Test Plan is already available. Inside this, we need to add a Thread Group.
Inside that Thread Group, we need to add two samplers – a JDBC Connection Configuration and a JDBC Request sampler.
Also, under the Test Plan we can add a View Results in Table and a View Results Tree listeners.
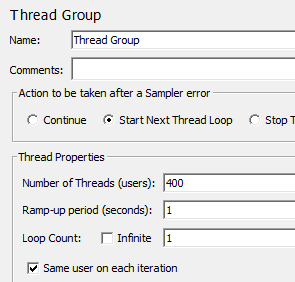
Thread Group
This dictates how many threads ( or users ) are parallelly trying to access the application.
I set the Number of Threads (users) to 400 and the Ramp-up period (seconds) to 1.
I also put an Action to be taken after a Sampler Error to Start Next Thread Loop.
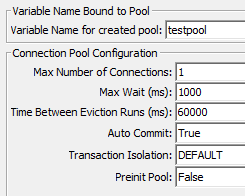
JDBC Connection Configuration
For this, two things need to be set
- Connection Pool Configuration
The Variable Name needs to be set here. This can be anything but will be used later in the JDBC Request configuration.
Also, I’ve set the Max wait (ms) to 1000 (1 second)
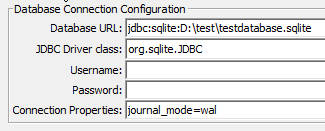
- Database Connection Configuration
Here, the Database URL has to have the path to the SQLite Database. So, if the path is D:\test\testdatabase.sqlite, then the URL has to be –
jdbc:sqlite:D:\test\testdatabase.sqlite
Against the JDBC Driver class select org.sqlite.JDBC
And finally, and most importantly, under Connection Properties set it as journal_mode=wal
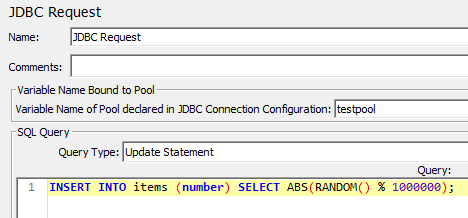
JDBC Request
For the JDBC request, the variable name needs to be the same as the one set in the JDBC Connection Configuration.
For the SQL Query, I added an update statement. This does an insert of a random number.
INSERT INTO items (number) SELECT ABS(RANDOM() % 1000000);
That completes the configuration of the JDBC Test.
Running the test
It is advisable to run the test from the command line. However, it can also be run from the GUI, by clicking on the Play button.
To run it from the command line, save the Test Plan and then from the command line –
jmeter.bat -n -t <path to test plan.jmx> -l <path to results.csv> -e -o <path to results folder>
I created a reports folder and saved all the results there. My command –
jmeter.bat -n -t ./SQLite_WAL_test.jmx -l ./reports/results-2021-06-06.csv -e -o ./reports/reports-2021-06-06
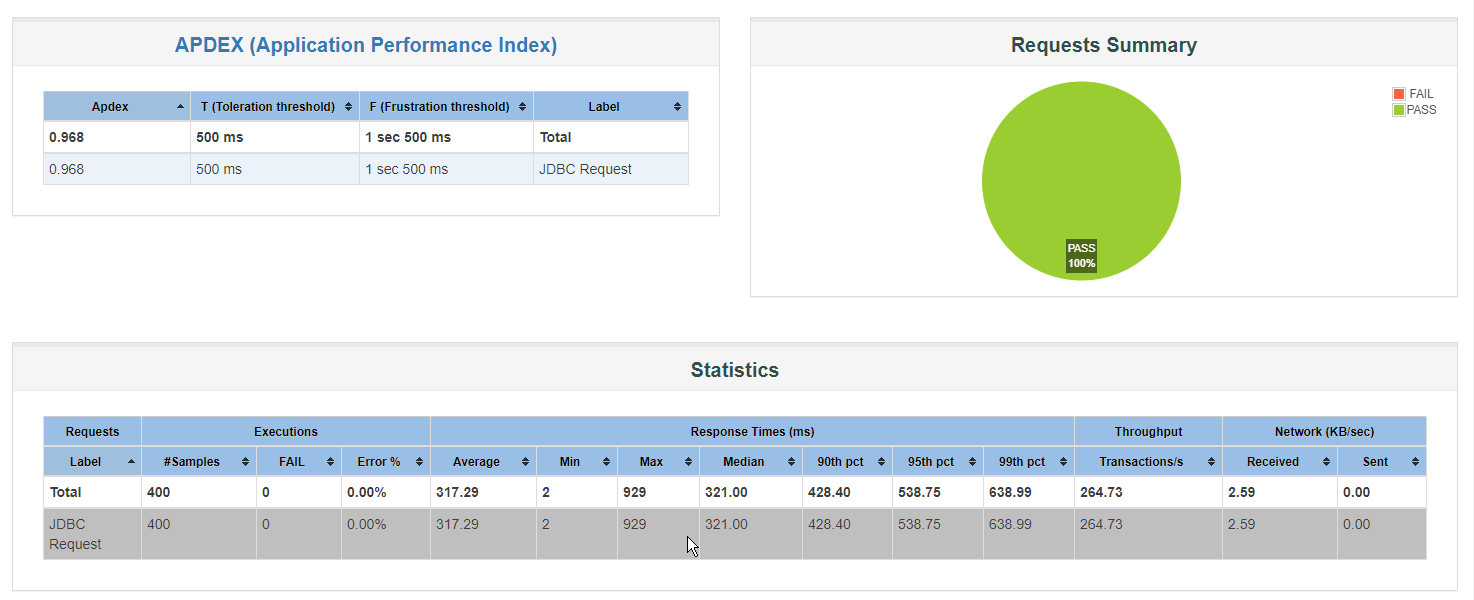
Which gave me some nice graphs and charts when I browsed the directory reports-2021-06-06 folder.
Summary
For direct JDBC updates, 400 inserts in one second is quite impressive! And for none of the applications I’ve created till date has that kind of demand.